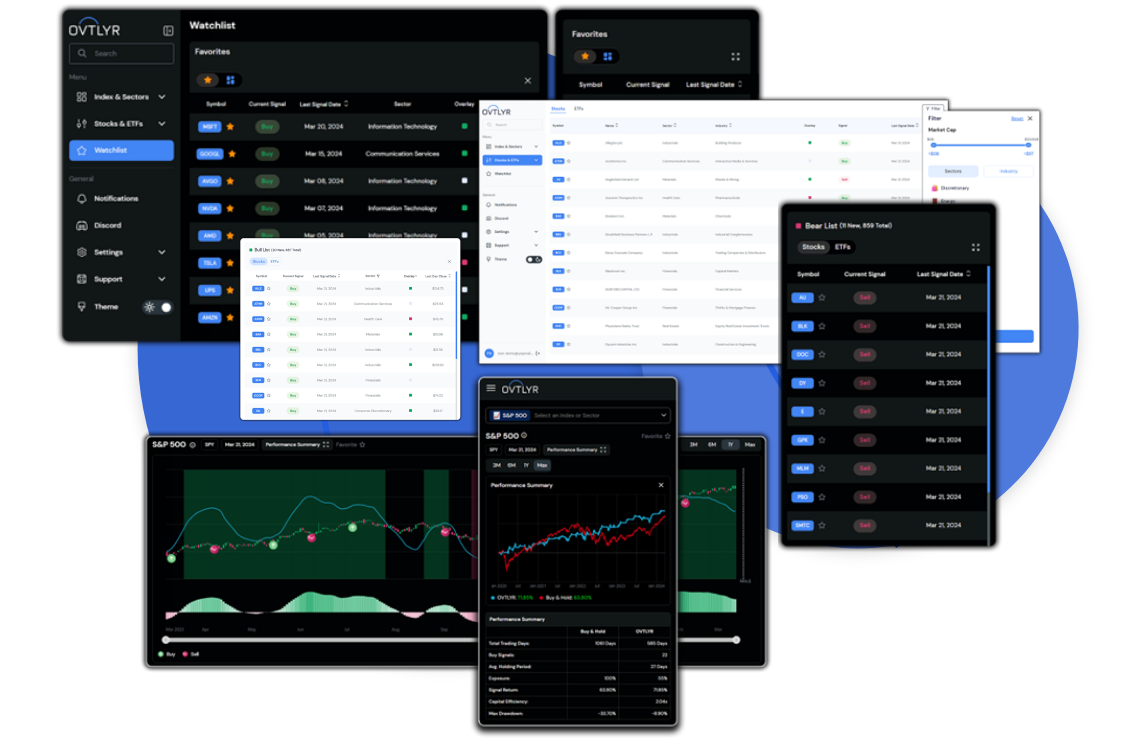
Built using our unique data & advanced A.I, these signals pinpoint profitable opportunities, minimizing losses. This tool enhances trading strategies, ensuring timely decisions in a fluctuating market.
“Outperformance requires leverage, selective contrarianism, or both”
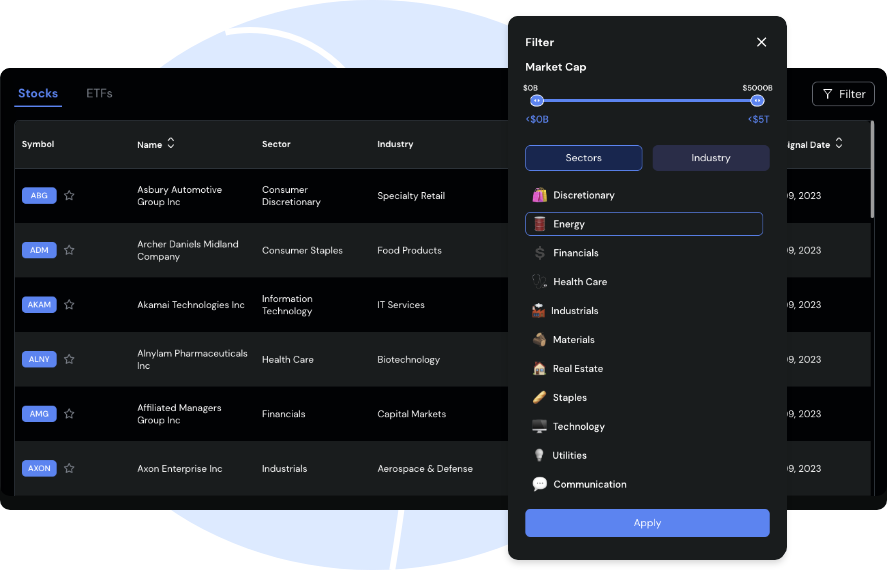
Build your List with market cap, sector & Industry Filters.
This streamlines & curates most recent Buy & Sell signals for Stocks & ETFs for potential hot trade setup. A clear daily count of opportunities provides holistic view of potential Bull or Bear market conditions.
The Price Trajectory Oscillator is an innovative indicator that provides traders with a clear view of stock trajectory direction and potential reversals. Our trajectory oscillator predicts where stock or ETF price trajectory is headed for the near-to-intermediate future, ensuring traders can make informed decisions and capitalize on market shifts.
“Know when you are swimming with or against the market current”
Our Behavioral heatmap charts provides visibility into changing Investor Sentiment for over 1600 stocks & ETFs. Areas of Fear (red) & Greed (green) are highlighted to show you when investors have OVERREACTED to current financial & economic conditions. These Charts offer a unique edge that no other tool provides, enabling profits when others react emotionally.
“Be greedy when others are fearful and be fearful when others are greedy”
The Uptrend (Green Overlays) & Downtrend (Red Overlays) are pivotal indicators for traders, offering timely alerts to ride through an ongoing uptrend or sidestep significant market pullbacks. By identifying these uptrends & downtrends you can navigate market with more confidence and unpresented foresight.
“In the stock market, the trend is your friend… until it isn’t”
Daily Visual snapshot of companies ranked for their OVTLYR Fear & Greed score within an Index or sector provides an excellent confirmation of the evolving trend that help build a strong trading strategy while keeping a medium to long term view in sight.
OVTLYR’s unique approach to calculating downside & upside volatility independently showcases the “real risk” of owning a stock. It helps you understand about how stock has responded to volatility in past.
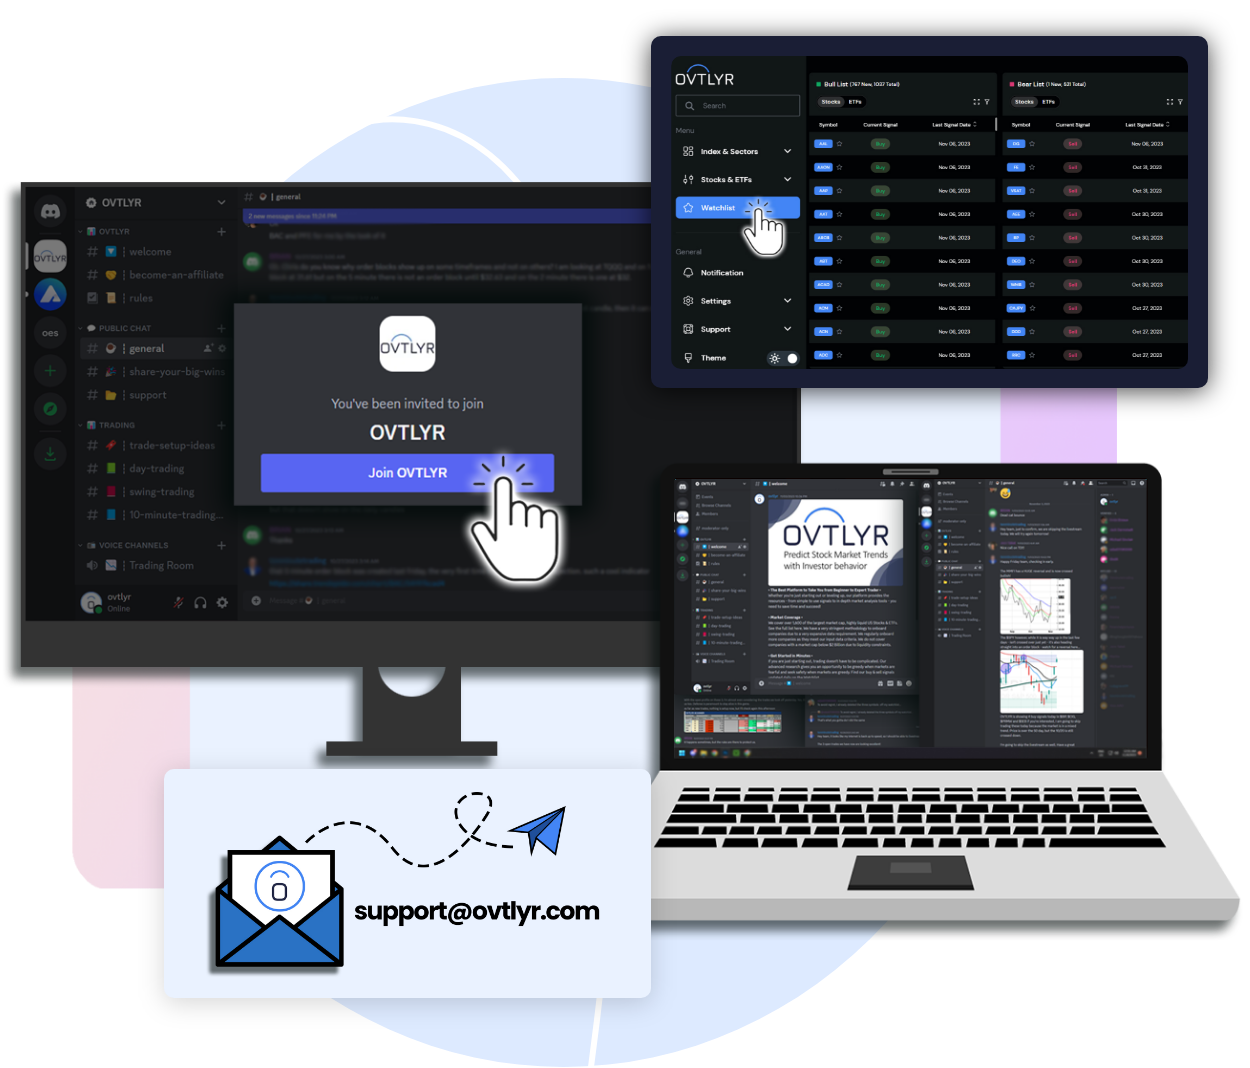
Trading room supported by Pro Traders
Access to Growing OVTLYR trading community
One of the Best Support networks in the industry
The Favorite List is a streamlined tool for investors to monitor and engage with their preferred stocks. Curate your personalized list, track stock performance, stay updated & act promptly on market movements.
Receive timely alerts on your favorite stocks. These updates ensure investors are promptly informed of significant market movements, enabling them to act swiftly and make informed decisions.
Coverage of Over 1,600 of the Highest Liquidity U.S. Listed Stocks & ETFs: OVTLYR emphasizes quality over quantity, focusing on “blue chip” large & upper-mid cap U.S. stocks & ETFs with a combined market capitalization over $40T. This curated selection ensures traders engage with the most stable and liquid assets, optimizing their trading experience, reliability, and potential returns.