Market
By Christopher M. Uhl
As a trader, it's easy to get overwhelmed by all the indicators and tools out there, but a few key ones can really make a difference. Instead of getting too caught up in specific settings or tiny details, it's important to keep your eye on the bigger picture and focus on a handful of solid strategies.
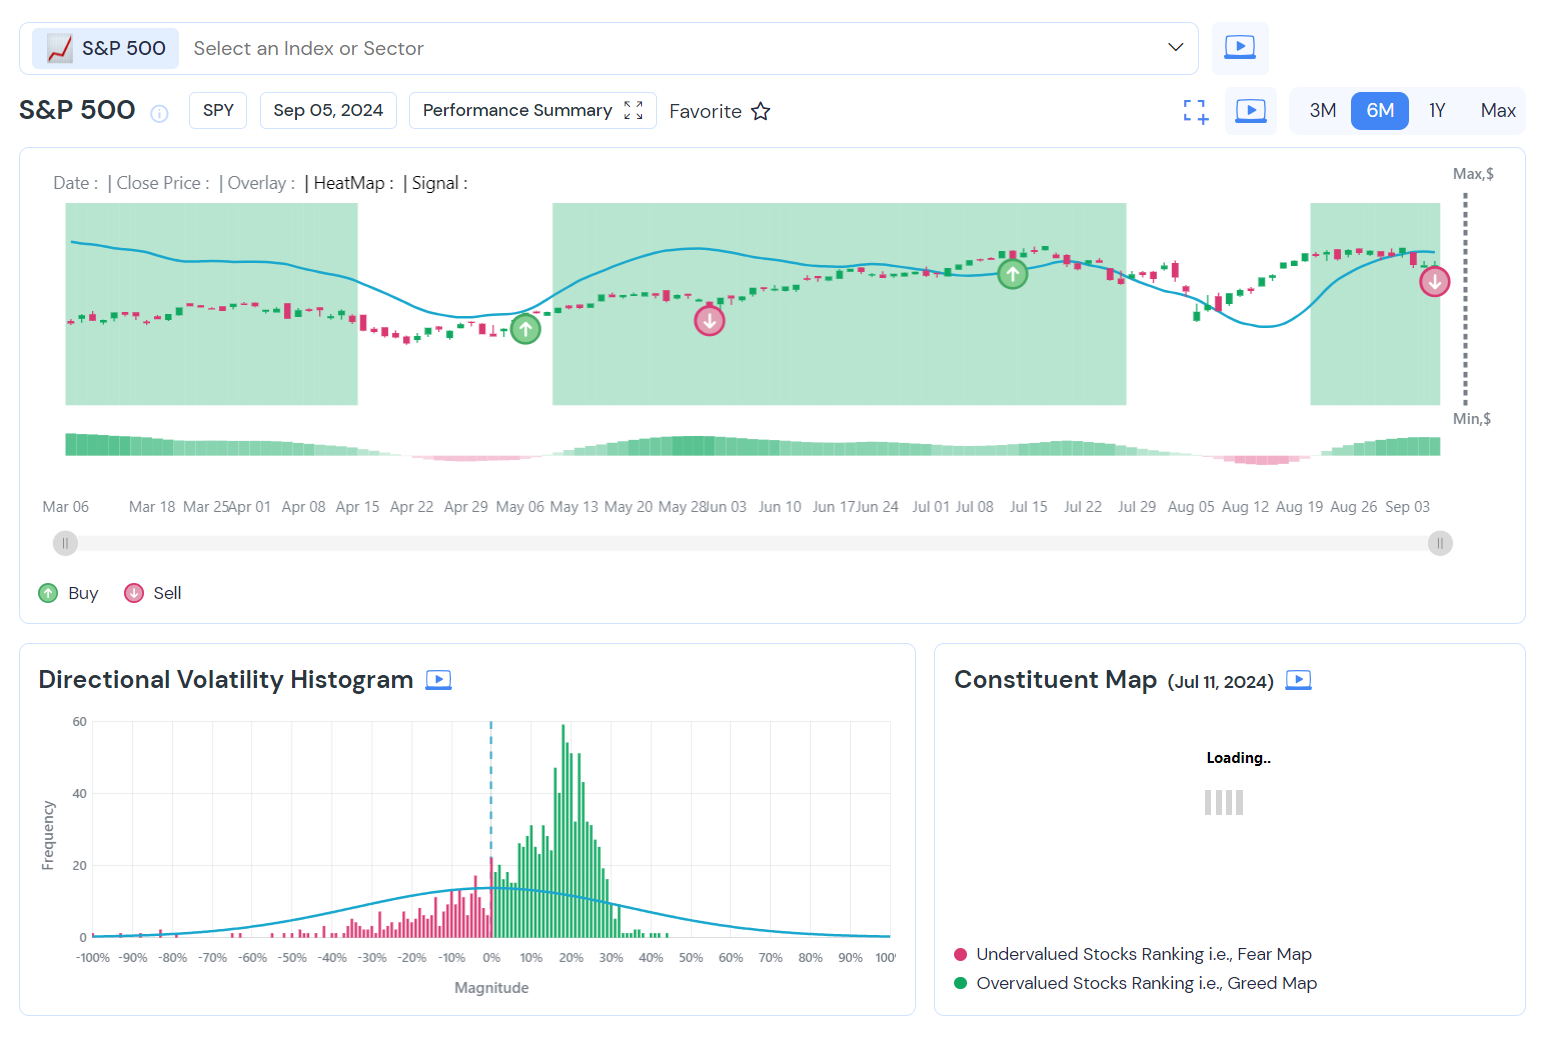
One such strategy is using buy and sell signals, like the ones in SPY. These signals give traders a heads-up on when to get in or out of a trade. It’s easy to overthink why certain signals pop up, but what really matters is reacting to the overall trend. For example, a recent sell signal on SPY clearly suggested that people holding long positions should think about exiting.
Another important factor is understanding market breadth, which shows whether most stocks are leaning bullish or bearish. If you notice more stocks moving from bullish to bearish, like we’ve seen recently, it’s a sign the market's mood is shifting. But don’t make moves based solely on that—wait for confirmation from other indicators like moving averages.
Moving averages, like the 10, 20, and 50-day, are great for cutting through the noise. For instance, when the 10 and 20-day averages dip below the 50-day, it can signal a bearish trend. However, don't jump into short positions too quickly—wait for this to line up with other signals, like price dropping below key levels or oscillators showing weakness.
Speaking of oscillators, tools like the price trajectory oscillator are awesome for predicting where a stock might go. It’s not a moving average but a forward-looking tool that can help you anticipate future price moves. It's especially useful when you're unsure about a stock's direction and need more confirmation for buy or sell signals.
Another great tool is the behavioral heat map, which shows whether investors are feeling fearful or greedy. When this indicator reaches extreme levels, it often signals a reversal is near. Stocks showing deep fear might be ready for a bounce, while extreme greed could mean a pullback is coming.
Lastly, capital efficiency looks at how much you’re earning from a signal compared to the time you're in a trade. High capital efficiency means you’re getting the most gains in the least amount of time, which is always the goal. Pair this with screeners to find trades that fit your strategy, and your trading process will become more streamlined and profitable.
By focusing on key indicators like buy and sell signals, market breadth, moving averages, oscillators, and behavioral heat maps, you can simplify your approach and avoid getting stuck in the weeds. These tools are powerful on their own, but the real value comes when you use them together to make smart decisions in the market.